たまに、ログ解析をしようとして、confを書こうとするとほとんど忘れていて困る・・・
で、いつも 大谷さんのサイト やelasticのサイトを見ては同じことを繰り返す。
そして毎回こんなconfを書く。
input {
     file {
        path => "/tmp/weblog/*/ssl_access_log.*"
        sincedb_path => "/tmp/weblog/.weblog.sincedb"
        start_position => "beginning"
     }
}

filter {
    grok {
       match => { "message" => "%{COMBINEDAPACHELOG}" }
       break_on_match => false
       tag_on_failure => ["_message_parse_failure"]
    }
   date {
       match => ["timestamp", "dd/MMM/YYYY:HH:mm:ss Z"]
       locale => en
    }
   geoip {
       source => ["clientip"]
   }
   grok {
       match => { "request" => "^/%{WORD:first_path}/%{GREEDYDATA}$" }
       tag_on_failure => ["_request_parse_failure"]
   }
   useragent {
       source => "agent"
       target => "useragent"
   }
}

output {
     elasticsearch {
         hosts => ["localhost:9200"]
         index => "wg_web_access_log-%{+YYYY}"
     }
}
上のconfでやっているのはこんな感じ。
・アクセスログは指定フォルダに保存したものをinputプラグイン(file)で読み込み。
・sincedb_pathは指定しておく。(筆者の場合、index消して再読み込みするケースがあるから)
・geoipプラグインで地理情報を付加する。
・タイムスタンプをログのタイムスタンプで置き換える。(logstashが出力した日時になっちゃうから)
・パースエラーのときはタグを付けてわかりやすくする。(大谷さんが書いているまんまです)
・出力先はelasticsearchへindex名指定で。
実行前に最低でも以下はやっとくべき。
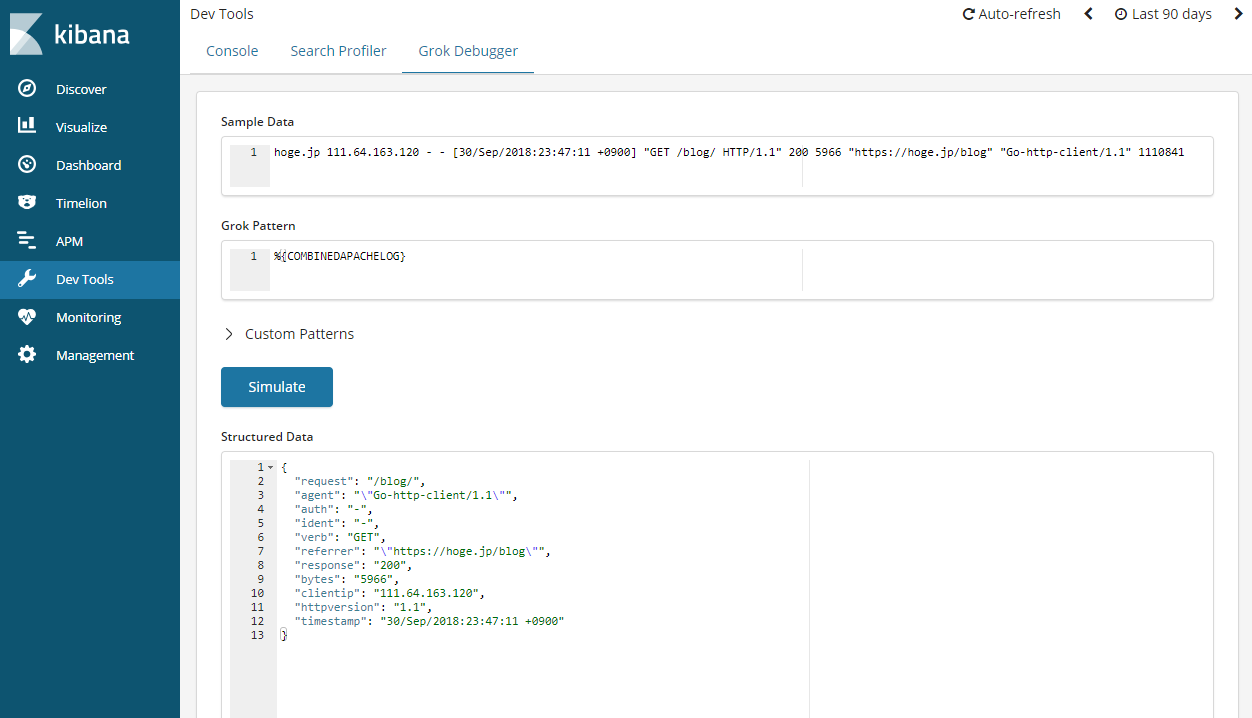
・kibanaの「Grok Debugger」でパースの確認をしておく。
・テストオプションでconfにエラーがないか確認する。
# /usr/share/logstash/bin/logstash -f /etc/logstash/conf.d/test.conf --path.settings /etc/logstash --config.test_and_exit
Sending Logstash logs to /var/log/logstash which is now configured via log4j2.properties
[2018-11-28T01:14:11,074][WARN ][logstash.config.source.multilocal] Ignoring the ‘pipelines.yml’ file because modules or command line options are specified
Configuration OK
いじょ。