
Filebeatのインストール
また、また間が空きましたが。今回の記事は、Filebeatのインストール手順です。記事ではFilebeat 7.0を使用します。
1.設計要素
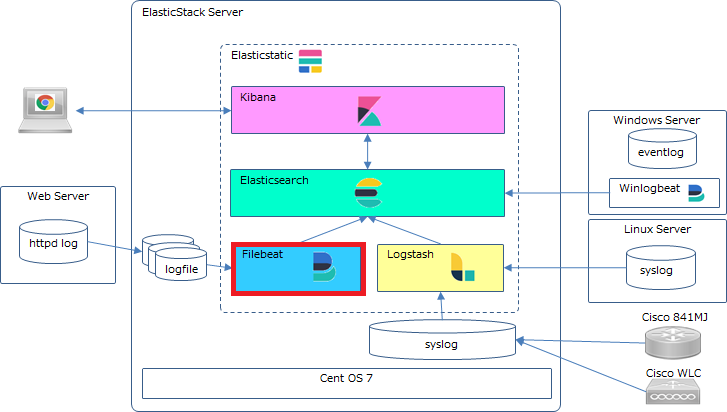
今回の筆者の前提環境では、Webサーバのログを随時Elastic Stackサーバへ保存してFilebeat経由でelasticsearchへ流し込む方式とします。(WebサーバはApacheとします)
Webサーバのログは、Apacheモジュールを使用して取り込むこととするのでfilebeat.ymlへはelasticsearchとkibanaのセットアップ定義くらい。(Filebeatの詳しい設定については、Filebeat Reference を参照してみてください) Webサーバのログを定期的にElastic Stackサーバーまで持ってくる方式のほうが重要。(筆者は毎日1回、rsyncでログファイルを持ってくる方式としています)
ログファイルは、日毎に以下のように保存する前提とします。
アクセスログ:/var/log/wisdomgate/ssl_access_log.20190515
エラーログ:/var/log/wisdomgate/ssl_error_log.20190515
2.インストール
インストールは他のパッケージと同様にyumで行います。
PGP Keyやリポジトリ設定はElasticsearchのインストールで設定済みなので割愛します。
⓵filebeatのインストール
#
# yum install filebeat
#
⓶設定ファイルの編集
filebeat.yml
以下の設定をします。(デフォルト値を変更した箇所のみ抜粋)
・Kibana ホスト名:Kibanaサーバのホスト名とport番号を設定
・elasticsearchホスト名:elasticsearchのホスト名とport番号を設定
#
#============================== Kibana =====================================

# Starting with Beats version 6.0.0, the dashboards are loaded via the Kibana API.
# This requires a Kibana endpoint configuration.
setup.kibana:

  # Kibana Host
  # Scheme and port can be left out and will be set to the default (http and 5601)
  # In case you specify and additional path, the scheme is required: http://localhost:5601/path
  # IPv6 addresses should always be defined as: https://[2001:db8::1]:5601
  host: "192.168.11.64:5601"

  # Kibana Space ID
  # ID of the Kibana Space into which the dashboards should be loaded. By default,
  # the Default Space will be used.
  #space.id:

#============================= Elastic Cloud ==================================

# These settings simplify using filebeat with the Elastic Cloud (https://cloud.elastic.co/).

# The cloud.id setting overwrites the `output.elasticsearch.hosts` and
# `setup.kibana.host` options.
# You can find the `cloud.id` in the Elastic Cloud web UI.
#cloud.id:

# The cloud.auth setting overwrites the `output.elasticsearch.username` and
# `output.elasticsearch.password` settings. The format is `<user>:<pass>`.
#cloud.auth:

#================================ Outputs =====================================

# Configure what output to use when sending the data collected by the beat.

#-------------------------- Elasticsearch output ------------------------------
output.elasticsearch:
  # Array of hosts to connect to.
  hosts: ["localhost:9200"]

  # Optional protocol and basic auth credentials.
  #protocol: "https"
  #username: "elastic"
  #password: "changeme"
#
⓷INDEXテンプレートのロード
Elastic Stack サーバでINDEXテンプレートをロードします。
#
# filebeat setup --template -E output.logstash.enabled=false -E 'output.elasticsearch.hosts=["localhost:9200"]'
Index setup complete.
#
⓸Dashboardのセットアップ
Elastic Stack サーバでFilebeat用のDashboardを作成します。
#
# filebeat setup --dashboards
Loading dashboards (Kibana must be running and reachable)
Loaded dashboards
#
⑤Apacheモジュールの有効化
#
# filebeat modules enable apache
#
⑥apache.ymlの編集
/etc/filebeat/modules.d 配下にある apache.yml を編集する。
# Module: apache
# Docs: https://www.elastic.co/guide/en/beats/filebeat/7.0/filebeat-module-apache.html

- module: apache
  # Access logs
  access:
    enabled: true

    # Set custom paths for the log files. If left empty,
    # Filebeat will choose the paths depending on your OS.
    var.paths: ["/var/log/wisdomgate/ssl_access_log.*"]
  # Error logs
  error:
    enabled: true

    # Set custom paths for the log files. If left empty,
    # Filebeat will choose the paths depending on your OS.
    var.paths: ["/var/log/wisdomgate/ssl_error_log.*"]
⑦filebeatの起動
以下コマンドを実行
#
# systemctl start filebeat
#
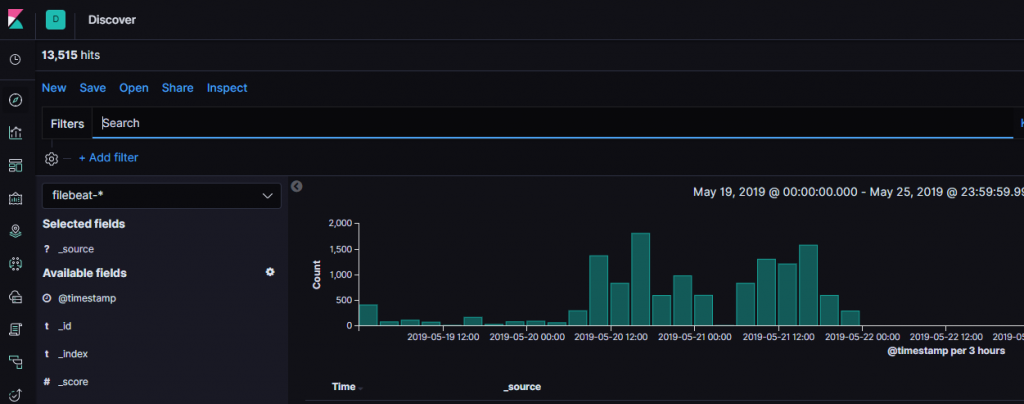
⑧INDEXの確認
DiscoverでINDEXにログが登録されている事を確認します。
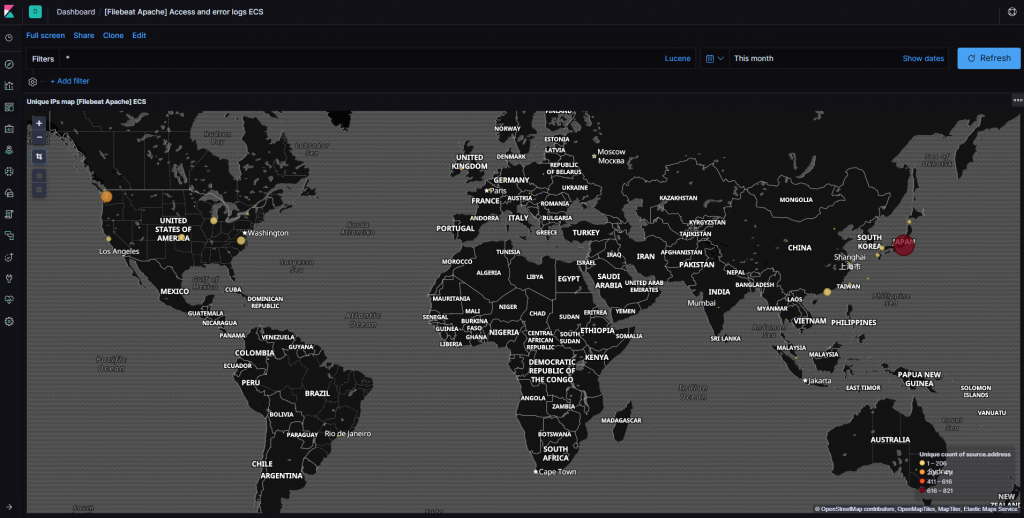
⑨Dashboard の確認
Filebeat(Apache)の Dashboard を確認します。
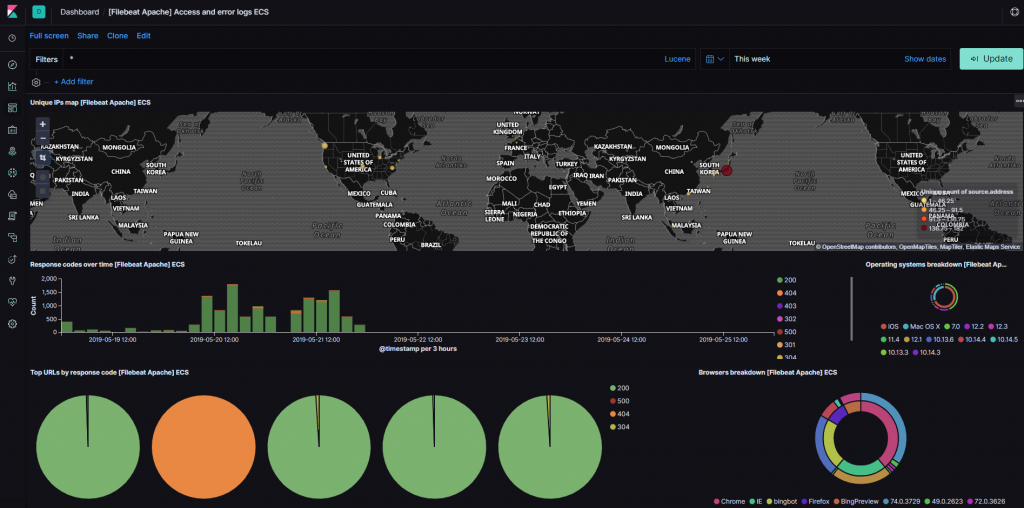
Geo ロケーションも表示できてます。
次回はLogstashによるデータ出力です。
いじょ。