Metricbeat + Jolokia Proxy + JMXでJVM監視 その1からの続きです。
1.Metricbeat(jolokiaモジュール)の設定
⓵ Metricbeatのインストール
Elastic Stack Server側へmetricbeatをインストール。
#
# yum -y install metricbeat
#
⓶ metricbeat.ymlの設定。(とりあえず出力先だけ設定)
###################### Metricbeat Configuration Example #######################

# This file is an example configuration file highlighting only the most common
# options. The metricbeat.reference.yml file from the same directory contains all the
# supported options with more comments. You can use it as a reference.
#
# You can find the full configuration reference here:
# https://www.elastic.co/guide/en/beats/metricbeat/index.html

#==========================  Modules configuration ============================

metricbeat.config.modules:
  # Glob pattern for configuration loading
  path: ${path.config}/modules.d/*.yml

  # Set to true to enable config reloading
  reload.enabled: false

  # Period on which files under path should be checked for changes
  #reload.period: 10s

~省略~

#================================ Outputs =====================================

# Configure what output to use when sending the data collected by the beat.

#-------------------------- Elasticsearch output ------------------------------
output.elasticsearch:
  # Array of hosts to connect to.
  hosts: ["localhost:9200"]

  # Optional protocol and basic auth credentials.
  #protocol: "https"
  #username: "elastic"
  #password: "changeme"

~省略~
⓷ jolokia moduleの有効化
#
# metricbeat modules enable jolokia
Enabled jolokia
#
jolokia moduleが有効になったことを確認
#
# metricbeat modules list
Enabled:
jolokia
system

Disabled:
aerospike
apache
aws
ceph
consul
coredns
couchbase
couchdb
docker
dropwizard
elasticsearch
elasticsearch-xpack
envoyproxy
etcd
golang
graphite
haproxy
http
jolokia
kafka
kibana
kibana-xpack
kubernetes
kvm
logstash
memcached
mongodb
mssql
munin
mysql
nats
nginx
php_fpm
postgresql
prometheus
rabbitmq
redis
traefik
uwsgi
vsphere
windows
zookeeper
#
⓸ jolokia.ymlの編集
・収集間隔やjolokia proxyサーバの指定
- module: jolokia
  metricsets: ["jmx"]
  period: 10s ← 収集間隔(デフォルト10秒 、短くしても5秒くらいまでかと)
  hosts: ["sves0002:8080"] ←jolokia proxyサーバ名とポート(筆者の環境では Elastic Stack Server )
  namespace: "metrics"
・収集したいメトリックの指定
ここに記載していく値はAPサーバにより異なるのでJconsoleのMbeanタブ等で値を確認しながら設定すると間違いが少ないかと。
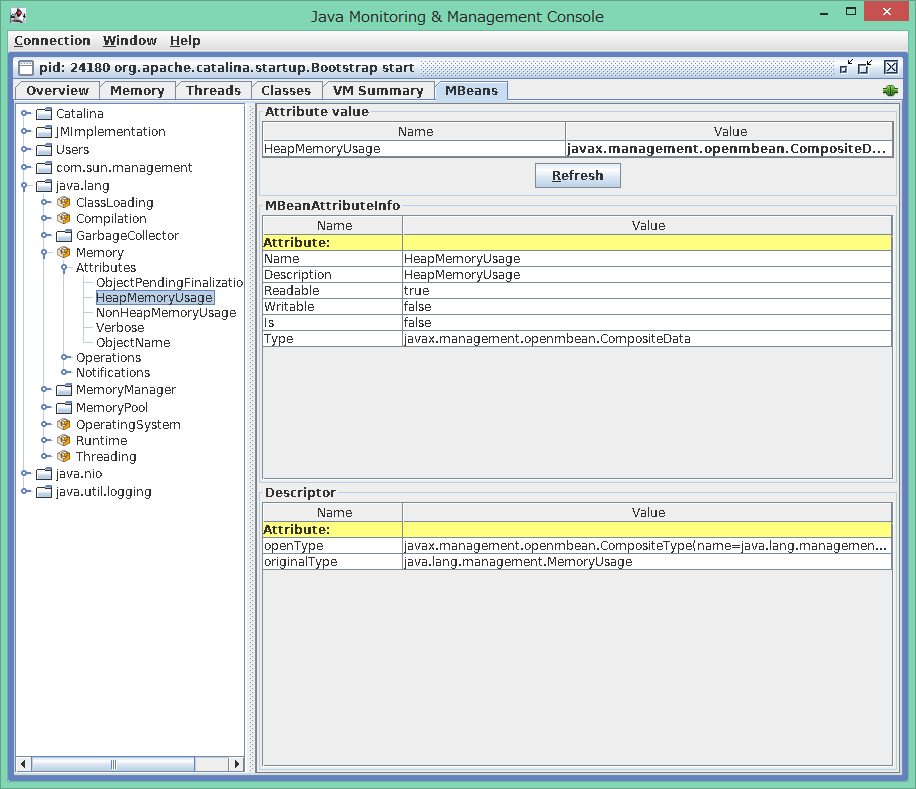
MbeanのObjectName毎に取得したいAttribute名を繰り返し書いていきます。 以下は、HeapMemoryUsageとNonHeapMemoryUsage の値を収集する場合の例。
 jmx.mappings:
   - mbean: 'java.lang:type=Memory' ← MbeanのObjectNameを指定
      attributes:
        - attr: HeapMemoryUsage  ← MbeanのAttribute名を指定
          field: memory.heap_usage ← elasticsearch出力時のフィールド名を指定
        - attr: NonHeapMemoryUsage  ← MbeanのAttribute名を指定
          field: memory.non_heap_usage ← elasticsearch出力時のフィールド名を指定
      target:
          url: "service:jmx:rmi:///jndi/rmi://sves0001:8686/jmxrmi" ←取得したいターゲットサーバとJMX Port番号(筆者の環境ではApplication Server)
でいくつか取得したいMbeanの指定をしたjolokia.ymlが以下。
# Module: jolokia
# Docs: https://www.elastic.co/guide/en/beats/metricbeat/7.0/metricbeat-module-jolokia.html

- module: jolokia
  metricsets: ["jmx"]
  period: 10s
  hosts: ["sves0002:8080"]
  namespace: "metrics"
#  path: "/jolokia/?ignoreErrors=true&canonicalNaming=false"
  http_method: "POST"
  jmx.mappings:
    - mbean: 'java.lang:type=Runtime'
      attributes:
        - attr: Uptime
          field: uptime
      target:
          url: "service:jmx:rmi:///jndi/rmi://sves0001:8686/jmxrmi"
    - mbean: 'java.lang:type=Memory'
      attributes:
        - attr: HeapMemoryUsage
          field: memory.heap_usage
        - attr: NonHeapMemoryUsage
          field: memory.non_heap_usage
      target:
          url: "service:jmx:rmi:///jndi/rmi://sves0001:8686/jmxrmi"
    - mbean: 'java.lang:type=MemoryPool,name=Eden Space'
      attributes:
        - attr: CollectionUsage
          field: memory.eden.collection_usage
        - attr: PeakUsage
          field: memory.eden.peak_usage
        - attr: Usage
          field: memory.eden.usage
      target:
          url: "service:jmx:rmi:///jndi/rmi://sves0001:8686/jmxrmi"
    - mbean: 'java.lang:type=MemoryPool,name=Survivor Space'
      attributes:
        - attr: CollectionUsage
          field: memory.survivor.collection_usage
        - attr: PeakUsage
          field: memory.survivor.peak_usage
        - attr: Usage
          field: memory.survivor.usage
      target:
          url: "service:jmx:rmi:///jndi/rmi://sves0001:8686/jmxrmi"
#   GC Metrics - this depends on what is available on your JVM
    - mbean: 'java.lang:type=GarbageCollector,name=MarkSweepCompact'
      attributes:
        - attr: CollectionTime
          field: gc.cms_collection_time
        - attr: CollectionCount
          field: gc.cms_collection_count
      target:
          url: "service:jmx:rmi:///jndi/rmi://sves0001:8686/jmxrmi"
    - mbean: 'java.lang:type=GarbageCollector,name=Copy'
      attributes:
        - attr: CollectionTime
          field: gc.cp_collection_time
        - attr: CollectionCount
          field: gc.cp_collection_count
      target:
          url: "service:jmx:rmi:///jndi/rmi://sves0001:8686/jmxrmi"
    - mbean: Catalina:type=ThreadPool,name="http-nio-8080"
      attributes:
        - attr: maxThreads
          field: tomcat.http_8080.thread.max
        - attr: currentThreadCount
          field: tomcat.http_8080.thread.count
        - attr: currentThreadsBusy
          field: tomcat.http_8080.thread.busy
      target:
          url: "service:jmx:rmi:///jndi/rmi://sves0001:8686/jmxrmi"
    - mbean: Catalina:type=ThreadPool,name="ajp-nio-8009"
      attributes:
        - attr: maxThreads
          field: tomcat.ajp_8009.thread.max
        - attr: currentThreadCount
          field: tomcat.ajp_8009.thread.count
        - attr: currentThreadsBusy
          field: tomcat.ajp_8009.thread.busy
      target:
          url: "service:jmx:rmi:///jndi/rmi://sves0001:8686/jmxrmi"
  jmx.application:
  jmx.instance:
⑤ コンフィグの確認
metricbeatのtestコマンドでメトリックが取得できるか確認します。
#
# metricbeat test modules
jolokia...
  jmx...OK
    result:
    {
     "@timestamp": "2019-07-07T06:50:16.169Z",
     "event": {
      "dataset": "jolokia.metrics",
      "duration": 26398286,
      "module": "jolokia"
     },
     "jolokia": {
      "metrics": {
       "gc": {
        "cms_collection_count": 1,
        "cms_collection_time": 94,
        "cp_collection_count": 18,
        "cp_collection_time": 402
       },
       "memory": {
        "eden": {
         "collection_usage": {
          "committed": 286326784,
          "init": 286326784,
          "max": 286326784,
          "used": 0
         },
         "peak_usage": {
          "committed": 286326784,
          "init": 286326784,
          "max": 286326784,
          "used": 286326784
         },
         "usage": {
          "committed": 286326784,
          "init": 286326784,
          "max": 286326784,
          "used": 126392248
         }
        },
        "heap_usage": {
         "committed": 1037959168,
         "init": 1073741824,
         "max": 1037959168,
         "used": 197311512
        },
        "non_heap_usage": {
         "committed": 53149696,
         "init": 2555904,
         "max": -1,
         "used": 51440104
        },
        "survivor": {
         "collection_usage": {
          "committed": 35782656,
          "init": 35782656,
          "max": 35782656,
          "used": 759968
         },
         "peak_usage": {
          "committed": 35782656,
          "init": 35782656,
          "max": 35782656,
          "used": 35782656
         },
         "usage": {
          "committed": 35782656,
          "init": 35782656,
          "max": 35782656,
          "used": 759968
         }
        }
       },
       "tomcat": {
        "ajp_8009": {
         "thread": {
          "busy": 0,
          "count": 10,
          "max": 200
         }
        },
        "http_8080": {
         "thread": {
          "busy": 0,
          "count": 10,
          "max": 200
         }
        }
       },
       "uptime": 3630245
      }
     },
     "metricset": {
      "name": "jmx"
     },
     "service": {
      "address": "sves0002:8080",
      "type": "jolokia"
     }
    }

~省略~
#
2.Metricbeatの起動
#
# systemctl start metricbeat
#
3.メトリックデータの確認
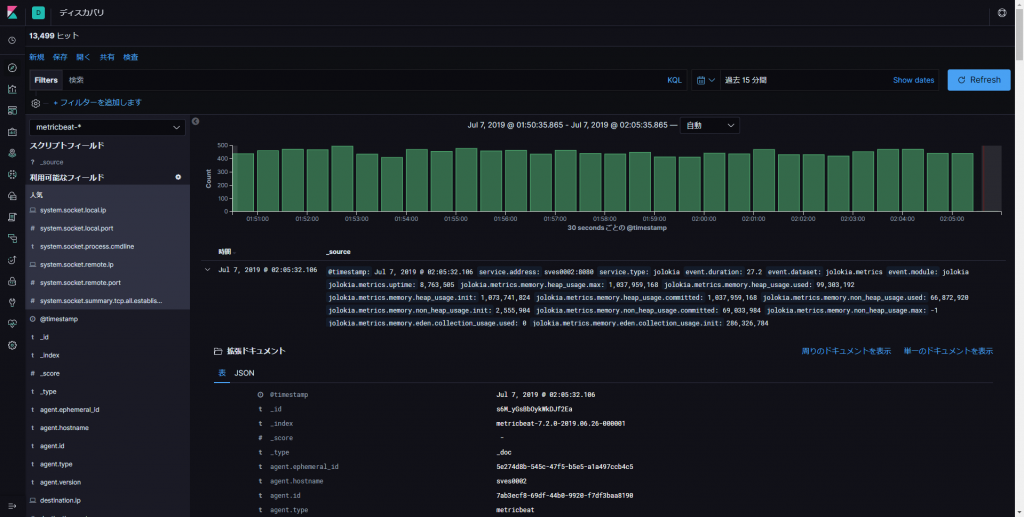
Discoveryを使って収集したデータを見てみましょう。 jolokiaモジュールで設定したメトリックが収集できているようです。
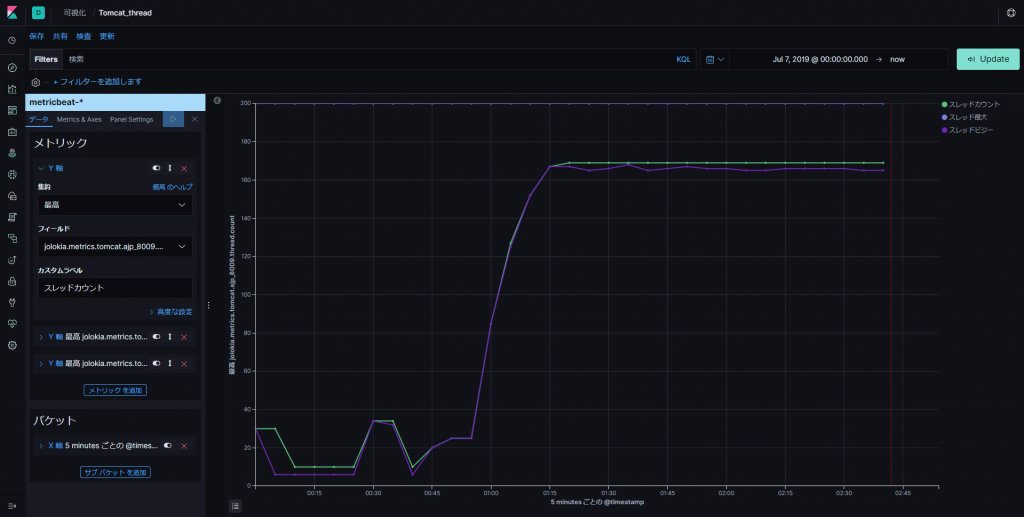
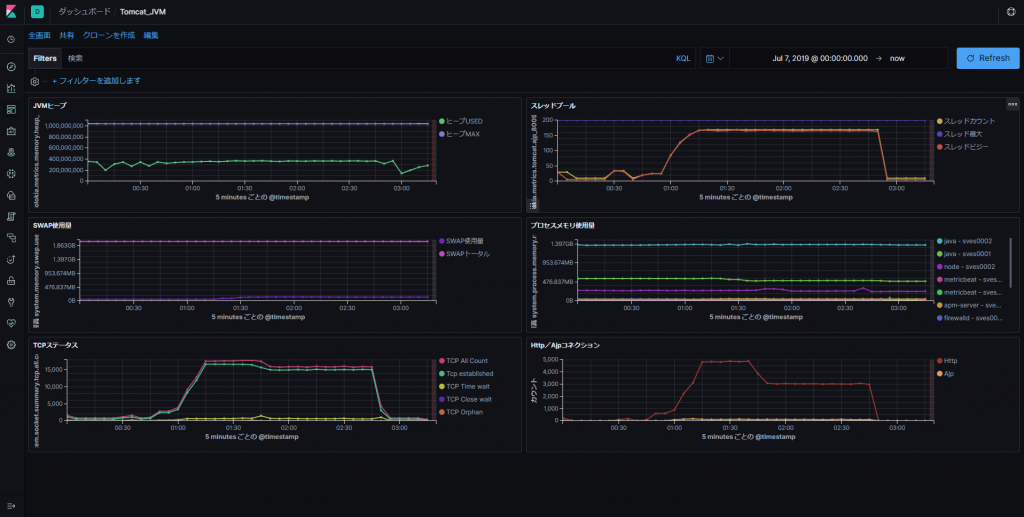
4.VisualizeとDashboardで可視化
Visualizeでグラフを保存して、Dashboardを作成。これで、メトリックの保存と可視化ができるようになったので、Webシステムの分析が楽になるかな。他にも欲しい情報がありますがまたの機会に。お疲れさまでした。